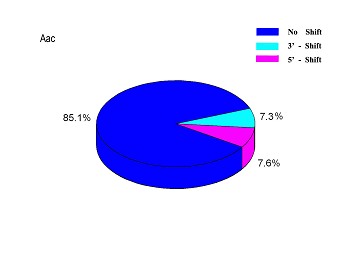
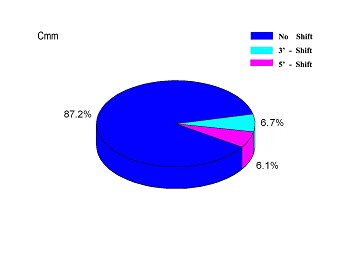
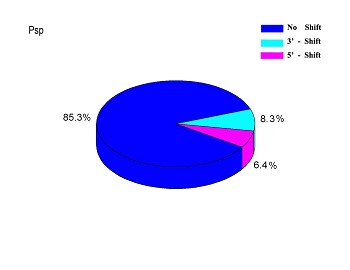
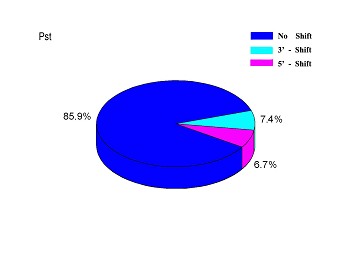
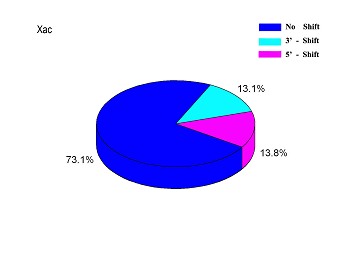
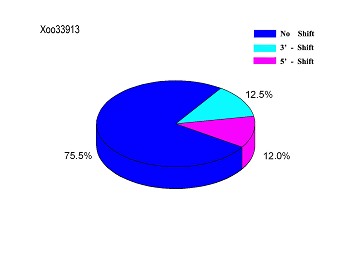
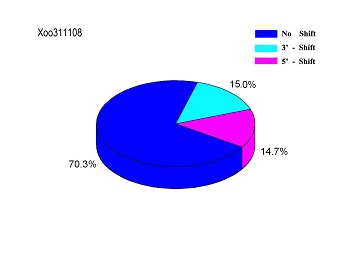
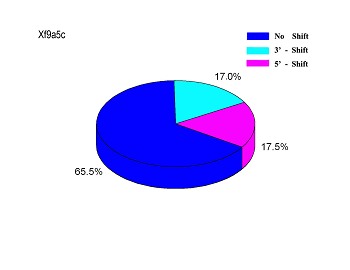
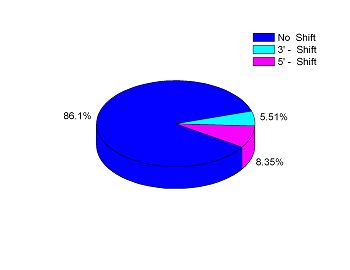
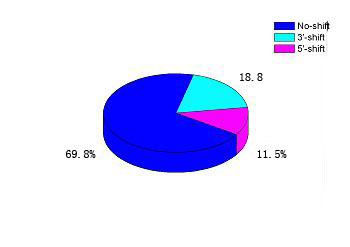
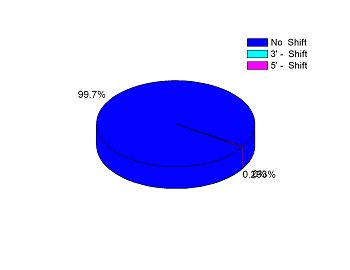
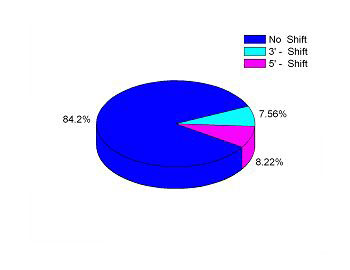
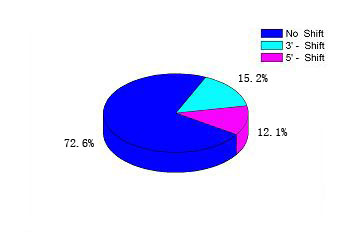
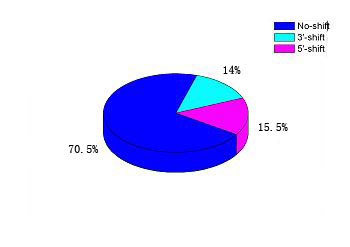
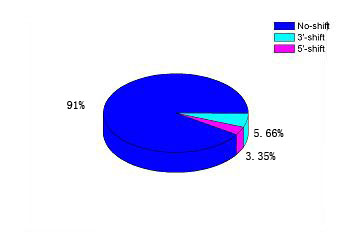
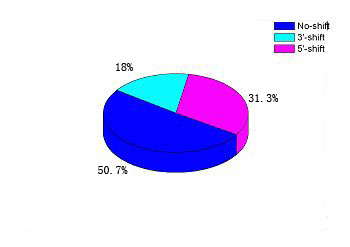
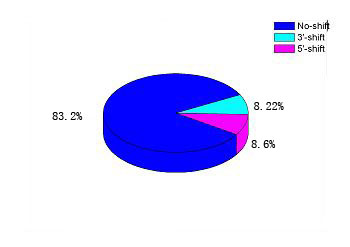
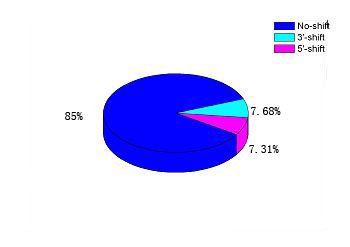
Figure 3 (a-p). The caky charts for relocation of translation initiation sites (TISs) in the 28 plant pathogens. Blue regions denote the percentage of the same TISs as the RefSeq annotation. Pink and light blue regions denote the percentage of 5’-shift and 3’-shift from the RefSeq annotation, respectively.
 |
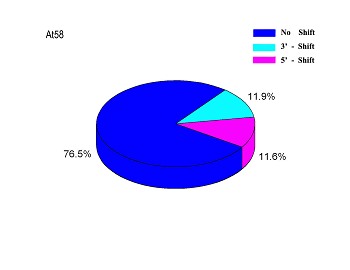 |
| (1) Acidovorax avenae subsp. citrulli AAC00-1 | (2) Agrobacterium tumefaciens str. C58 |
 |
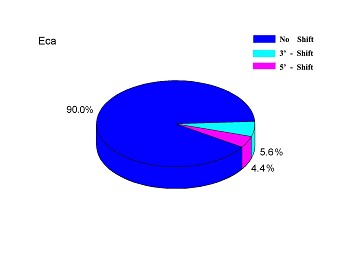 |
| (3) Clavibacter michiganensis subsp. michiganensis NCPPB 382 | (4) Erwinia carotovora subsp. atroseptica SCRI1043 |
 |
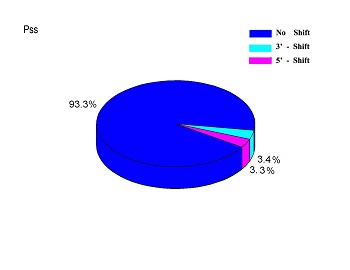 |
| (5) Pseudomonas syringae pv. phaseolicola 1448A | (6) Pseudomonas syringae pv. syringae B728a |
 |
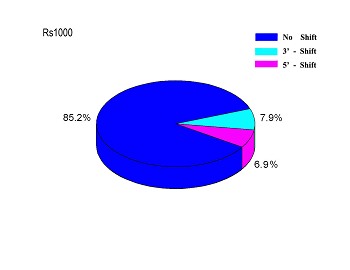 |
| (7) Pseudomonas syringae pv. tomato str.DC3000 | (8) Ralstonia solanacearum GMI1000 |
 |
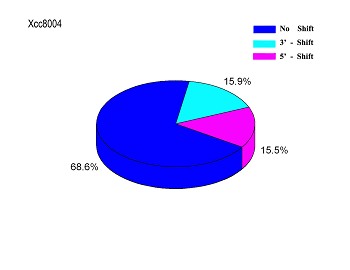 |
| (9) Xanthomonas axonopodis pv. citri str. 306 | (10) Xanthomonas campestris pv. campestris str. 8004 |
 |
 |
| (11) Xanthomonas campestris pv. campestris str. ATCC 33913 | (12) Xanthomonas campestris pv. vesicatoria str. 85-10 |
 |
 |
| (13) Xanthomonas oryzae pv. oryzae MAFF 311018 | (14) Xanthomonas oryzae pv. oryzae KACC10331 |
 |
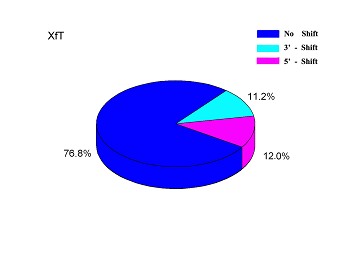 |
| (15) Xylella fastidiosa 9a5c | (16) Xylella fastidiosa Temecula1 |
 |
 |
| (17) Aster yellows witches'-broom phytoplasma strain AY-WB | (18) Leifsonia xyli subsp. xyli str. CTCB07 |
 |
 |
| (19) Mesoplasma florum L1 | (20) Onion yellows phytoplasma OY-M |
 |
 |
| (21) Agrobacterium vitis S4 | (22) Clavibacter michiganensis subsp. sepedonicus ATCC 33113 |
 |
 |
| (23) Candidatus Phytoplasma australiense | (24) Candidatus Phytoplasma mali |
 |
 |
| (25) Xanthomonas campestris pv. campestris str. B100 | (26) Xanthomonas oryzae pv. oryzae PXO99A |
 |
 |
| (27) Xylella fastidiosa M12 | (28) Xylella fastidiosa M23 |