Method for re-recognizing non-coding hypothetical ORFs
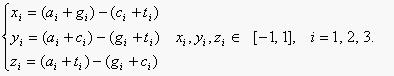
The methodology adopted here is based on the Z curve, which has been successfully applied to find genes in prokaryotic [1,2] and eukaryotic genomes [3,4]. Here the algorithm is presented briefly as follows. The frequencies of bases A, C, G and T occurring in an ORF or a fragment of DNA sequence with bases at positions 1, 4, 7, ...; 2, 5, 8, ...; 3, 6, 9, ..., are denoted by a1, c1, g1, t1; a2, c2, g2, t2; a3, c3, g3, t3, respectively. They are in fact the frequencies of bases at the first, second and third codon positions. Based on the Z curve, ai, ci, gi, ti are mapped onto a point Pi in a three-dimensional space Vi, i = 1, 2, 3. The coordinates of Pi, denoted by xi, yi, zi, are determined by the Z-transform of DNA sequence [5].
The Z-transform of DNA sequence transforms the four frequencies of DNA bases into the coordinates of a point in a three-dimensional space. In addition to the frequencies of codon-position-dependent single nucleotides, the frequencies of phase-specific di-nucleotides are also considered. Let the frequencies of the 16 di-nucleotides AA, AC, ..., and TT of an ORF or a fragment of DNA sequence be denoted by p(AA), p(AC), ..., p(TT) respectively. Using the Z-transform

where xX, yX and zX are the coordinates, X = A, C, G, T. Let the three-dimensional space VX be spanned by xX, yX and zX. The direct-sum of the subspaces V1, V2, V3, VA, VC, VG and VT is denoted by a 21-dimensional space V, i.e. V = V1 V2 V3 VA VC VG VT, where the symbol denotes the direct-sum of two subspaces. The 21 components of the space V, i.e. u1, u2, ..., u21, are defined as follows:

Therefore, an ORF or a fragment of DNA sequence can be represented by a point or a vector in the 21-dimensional space V. Note that ui [¨C1, +1], i = 1, 2, ..., 21.Therefore, the space V is a 21-dimensional super-cube with the side length of 2. To complete the algorithm, two groups of samples are needed. One is a set of the positive samples corresponding to protein-coding genes, and the other is a set of control (negative) samples corresponding to the non-coding sequences. The two groups of samples constitute the training set, used in the Fisher discrimination algorithm described below. Before calculating the Fisher coefficients, the strategy to produce the negative samples needs to be mentioned. Since the amount of non-coding DNA sequences is too few to be used, it is a rather difficult problem to prepare an appropriate set of non-coding sequences in bacterial genomes. Furthermore, the intergenic sequences are generally dominated by structural RNA sequences or other functional elements. To solve the problem, a method to produce negative samples is presented. Each of the protein-coding genes is randomly shuffled 10,000 times, so that it can be transformed into a random sequence. The shuffled sequence then served as a non-coding sample. The Fisher linear equation for discriminating the positive and negative samples in the 21-dimensional space V represents a super-plane, described by a vector c which has 21 components c1, c2, ..., and c21. Based on the data in the training set (including the positive and negative samples), an appropriate threshold c0 is determined to make the coding/non-coding decision. The threshold c0 is uniquely determined by making the false negative rate and the false positive rate equal. Once the vector c and the threshold c0 are obtained, the decision of coding/non-coding for each ORF is simply made by the criterion of c'u > c0 / c'u < c0, where c = (c1, c2, ..., c21)T, u = (u1, u2, ..., u21)T, and ˇ®TˇŻ indicates the transpose of a matrix. The criterion of c*u > c0 / c*u < c0 for making the decision of coding/non-coding can be rewritten as Z(u)>0/Z(u) < 0, where Z(u) = c*u ¨C c0. Z(u) is called the Z score or Z index for an ORF or a fragment of DNA sequence.
References
[1] Guo,F.B., Ou,H.Y. and Zhang, C.T. (2003) ZCURVE: a new system for recognizing protein-coding genes in bacterial and archaeal genomes. Nucleic Acids Res., 31, 1780-1789.
[2] Chen, L.L. and Zhang, C.T. (2003) Gene recognition from questionable ORFs in bacterial and archaeal genomes. J Biomol Struct Dyn., 21, 99-110.
[3] Zhang, C.T. and Wang, J. (2000) Recognition of protein coding genes in the yeast genome at better than 95% accuracy based on the Z curve. Nucleic Acids Res., 28, 2804-2814.
[4] Gao, F. and Zhang, C.T. (2004) Comparison of various algorithms for recognizing short coding sequences of human genes. Bioinformatics, 20, 673-681.
[5] Zhang, C.T. and Zhang, R. (1991) Analysis of distribution of bases in the coding sequences by a diagrammatic technique. Nucleic Acids Res., 19, 6313-6317.