Search:
by
Please select
Gene Name
DIGAP_ID
PID
Function
Home
Phytopathogens
Blast
Targets
Statistics
Documents
Download
Link
[Z-curve]
[E(g) and CAI]
[Figure1 Flowchart]
[Figure2 Scatter]
[Figure3 Cakychart]
[Figure4 Histogram]
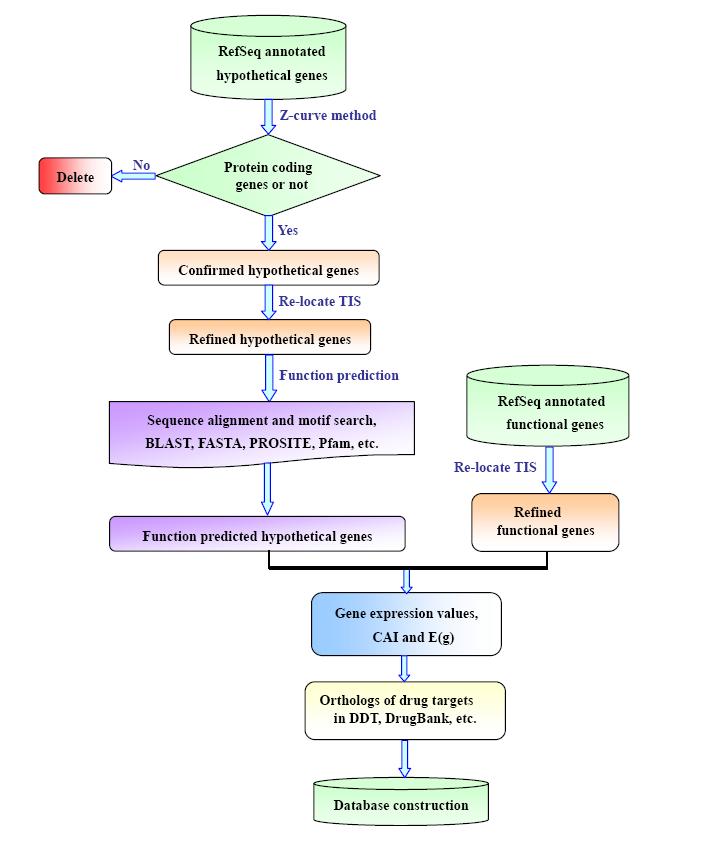
Figure 1
. Flowchart depicting the strategy to refine the annotation of 28 plant pathogens.
First
Previous
Next
Last
Home
Targets
Statistics
Download
Contact
|
IBI©Copyright 2009.
Last update on Nov. 15, 2009.