
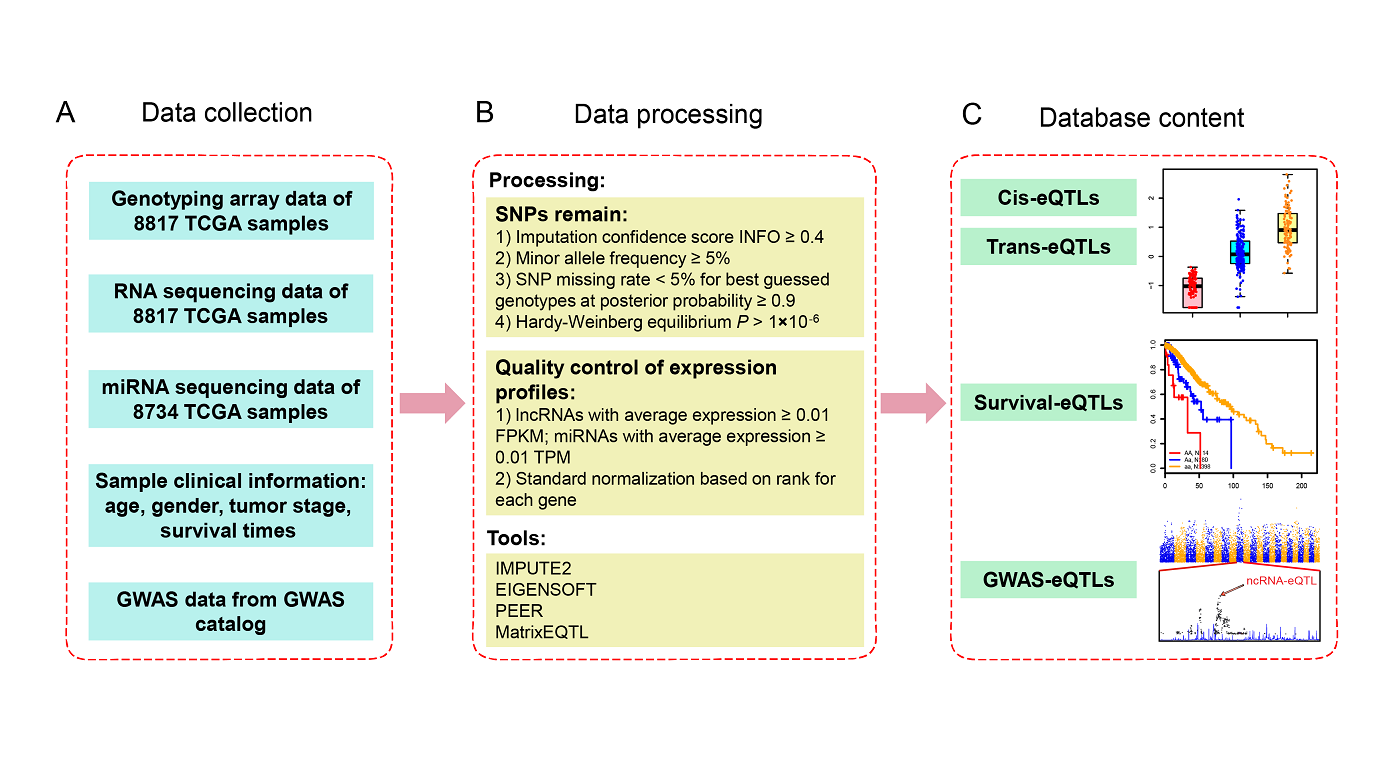
miRNA-eQTL aims to comprehensively provide miRNA-related cis-eQTLs
(SNPs affect local miRNA gene expression)
and trans-eQTLs (SNPs affect distant miRNA gene expression) in different cancer types from The Cancer Genome Atlas
(TCGA). We have identified 87,932 and
5,175 eQTL−gene pairs at FDR < 0.05 in 33 cancer types in cis-eQTL and
trans-eQTL analysis, respectively. To prioritize promising miRNA-eQTLs, we identified miRNA-eQTLs
associated with
patient survival times (survival-eQTLs) and located in GWAS linkage disequilibrium (LD) regions (GWAS-eQTLs). In
survival-eQTL, we identified 116 eQTLs
associated with patient overall survival times, and in GWAS-eQTL, we
identified 26,908 eQTLs pairs that overlap with GWAS linkage disequilibrium (LD) regions.
In miRNA-eQTL database, users can :

SNP ID: Reference id from dbSNP.
SNP Position: The position of SNP including chromosme.
Alleles: SNP alleles.
Gene Position: Strand : Gene genomic position including chromosome, gene region and strand.
r: The correlation coefficient.
Beta: Effect size of SNP on gene expression (calculated by linear regression using a computationally efficient eQTL analysis called Matrix eQTL).
P-value: P-value calculated by Matrix eQTL.
Display: Provide diagram of boxplot to display the association between SNP genotypes and gene expression.

LD: Linkage disequilibrium.
GWAS Traits: Traits linked with SNP.
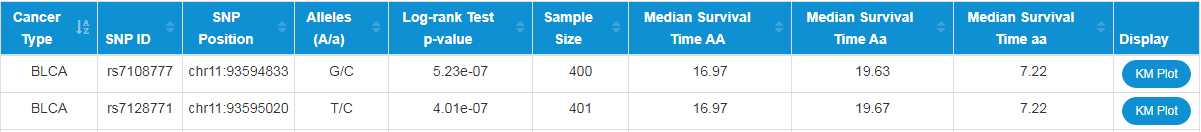
Sample Sizes: Number of samples in a cancer type.
Median Survival Time XX: Median survival times of different genotypes.
Display: Embedd diagram of the Kaplan–Meier plot to display the association between SNP genotypes and overall survival times..
| Cancer type | No. of samples | No. of miRNAs | No. of genotypes | Cis-pairs | Cis-miRNAs | Cis-eQTL | Trans-pairs | Trans-miRNAs | Trans-eQTL |
|---|---|---|---|---|---|---|---|---|---|
| ACC | 77 | 744 | 3567953 | 69 | 6 | 69 | 2 | 1 | 2 |
| BLCA | 400 | 761 | 4187341 | 3633 | 184 | 3336 | 298 | 49 | 283 |
| BRCA | 1059 | 646 | 2746002 | 6112 | 286 | 5633 | 388 | 112 | 311 |
| CESC | 242 | 732 | 4276554 | 2339 | 116 | 2248 | 62 | 20 | 62 |
| CHOL | 36 | 702 | 4012151 | 0 | 0 | 0 | 0 | 0 | 0 |
| COAD | 282 | 665 | 4505758 | 3098 | 152 | 2855 | 187 | 44 | 187 |
| DLBC | 46 | 733 | 4792599 | 6 | 1 | 6 | 0 | 0 | 0 |
| ESCA | 168 | 695 | 4445428 | 818 | 35 | 776 | 18 | 10 | 18 |
| GBM | 0 | 0 | 0 | 0 | 0 | 0 | 0 | 0 | 0 |
| HNSC | 489 | 741 | 4247859 | 6658 | 208 | 6083 | 95 | 37 | 91 |
| KICH | 66 | 638 | 3771773 | 150 | 6 | 150 | 0 | 0 | 0 |
| KIRC | 507 | 587 | 4578552 | 5420 | 209 | 4838 | 516 | 60 | 512 |
| KIRP | 289 | 670 | 4889138 | 3708 | 149 | 3504 | 329 | 39 | 329 |
| LAML | 113 | 516 | 5110458 | 404 | 16 | 369 | 15 | 2 | 15 |
| LGG | 499 | 771 | 4627361 | 8721 | 282 | 8262 | 440 | 100 | 393 |
| LIHC | 363 | 733 | 4159733 | 3647 | 172 | 3404 | 269 | 41 | 262 |
| LUAD | 504 | 738 | 4384032 | 4943 | 213 | 4545 | 210 | 67 | 200 |
| LUSC | 469 | 723 | 3741708 | 4595 | 190 | 4321 | 658 | 50 | 658 |
| MESO | 82 | 712 | 4747363 | 156 | 12 | 156 | 27 | 4 | 26 |
| OV | 289 | 727 | 2972304 | 1650 | 111 | 1559 | 127 | 24 | 126 |
| PAAD | 178 | 688 | 4996007 | 1615 | 80 | 1528 | 51 | 19 | 47 |
| PCPG | 175 | 779 | 4707759 | 1441 | 105 | 1346 | 144 | 23 | 138 |
| PRAD | 476 | 610 | 4824563 | 7462 | 233 | 6915 | 451 | 81 | 445 |
| READ | 91 | 681 | 4540674 | 479 | 25 | 469 | 10 | 3 | 10 |
| SARC | 255 | 645 | 4088430 | 1189 | 119 | 1133 | 133 | 22 | 131 |
| SKCM | 97 | 796 | 4831140 | 0 | 0 | 0 | 0 | 0 | 0 |
| STAD | 409 | 680 | 4305415 | 2948 | 115 | 2619 | 74 | 28 | 74 |
| TGCT | 148 | 993 | 4811363 | 1962 | 99 | 1862 | 169 | 20 | 164 |
| THCA | 497 | 742 | 4875197 | 11779 | 301 | 10028 | 328 | 62 | 318 |
| THYM | 120 | 951 | 4940145 | 1835 | 84 | 1662 | 108 | 15 | 107 |
| UCEC | 175 | 748 | 4953072 | 702 | 50 | 702 | 40 | 12 | 40 |
| UCS | 56 | 833 | 3888384 | 27 | 1 | 27 | 0 | 0 | 0 |
| UVM | 77 | 754 | 4692767 | 276 | 26 | 254 | 21 | 7 | 21 |
| Cancer type | Disease full name |
|---|---|
| ACC | Adrenocortical carcinoma |
| BLCA | Bladder urothelial carcinoma |
| BRCA | Breast invasive carcinoma |
| CESC | Cervical squamous cell carcinoma and endocervical adenocarcinoma |
| CHOL | Cholangiocarcinoma |
| COAD | Colon adenocarcinoma |
| DLBC | Lymphoid neoplasm diffuse large B-cell lymphoma |
| ESCA | Esophageal carcinoma |
| GBM | Glioblastoma multiforme |
| HNSC | Head and neck squamous cell carcinoma |
| KICH | Kidney chromophobe |
| KIRC | Kidney renal clear cell carcinoma |
| KIRP | Kidney renal papillary cell carcinoma |
| LAML | Acute myeloid leukemia |
| LGG | Lower grade glioma |
| LIHC | Liver hepatocellular carcinoma |
| LUAD | Lung adenocarcinoma |
| LUSC | Lung squamous cell carcinoma |
| MESO | Mesothelioma |
| OV | Ovarian serous cystadenocarcinoma |
| PAAD | Pancreatic adenocarcinoma |
| PCPG | Pheochromocytoma and paraganglioma |
| PRAD | Prostate adenocarcinoma |
| READ | Rectum adenocarcinoma |
| SARC | Sarcoma |
| SKCM | Skin cutaneous melanoma |
| STAD | Stomach adenocarcinoma |
| TGCT | Testicular germ cell tumors |
| THCA | Thyroid carcinoma |
| THYM | Thymoma |
| UCEC | Uterine corpus endometrial carcinoma |
| UCS | Uterine carcinosarcoma |
| UVM | Uveal melanoma |