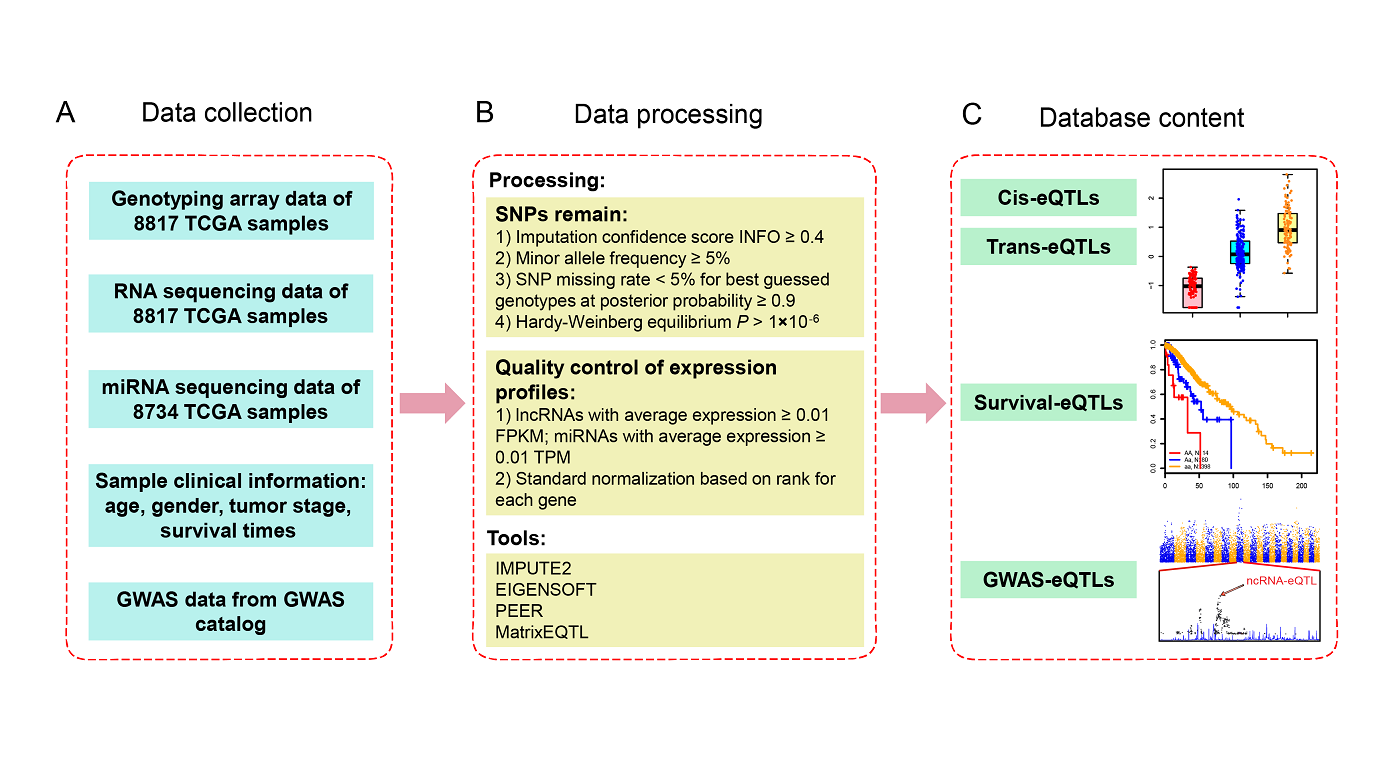
Numerous studies indicate that ncRNAs have critical functions across biological processes, and single nucleotide polymorphisms (SNPs) could contribute to diseases or traits through influencing ncRNA expression. However, the associations between SNPs and ncRNA expressions are largely unknown. Therefore, genome-wide expression quantitative trait loci (eQTL) analysis, especially the use of multiple cancer type data to assess the effect of SNPs on ncRNA expression, will help to understand how genetic risk alleles contribute towards tumorigenesis and cancer development.
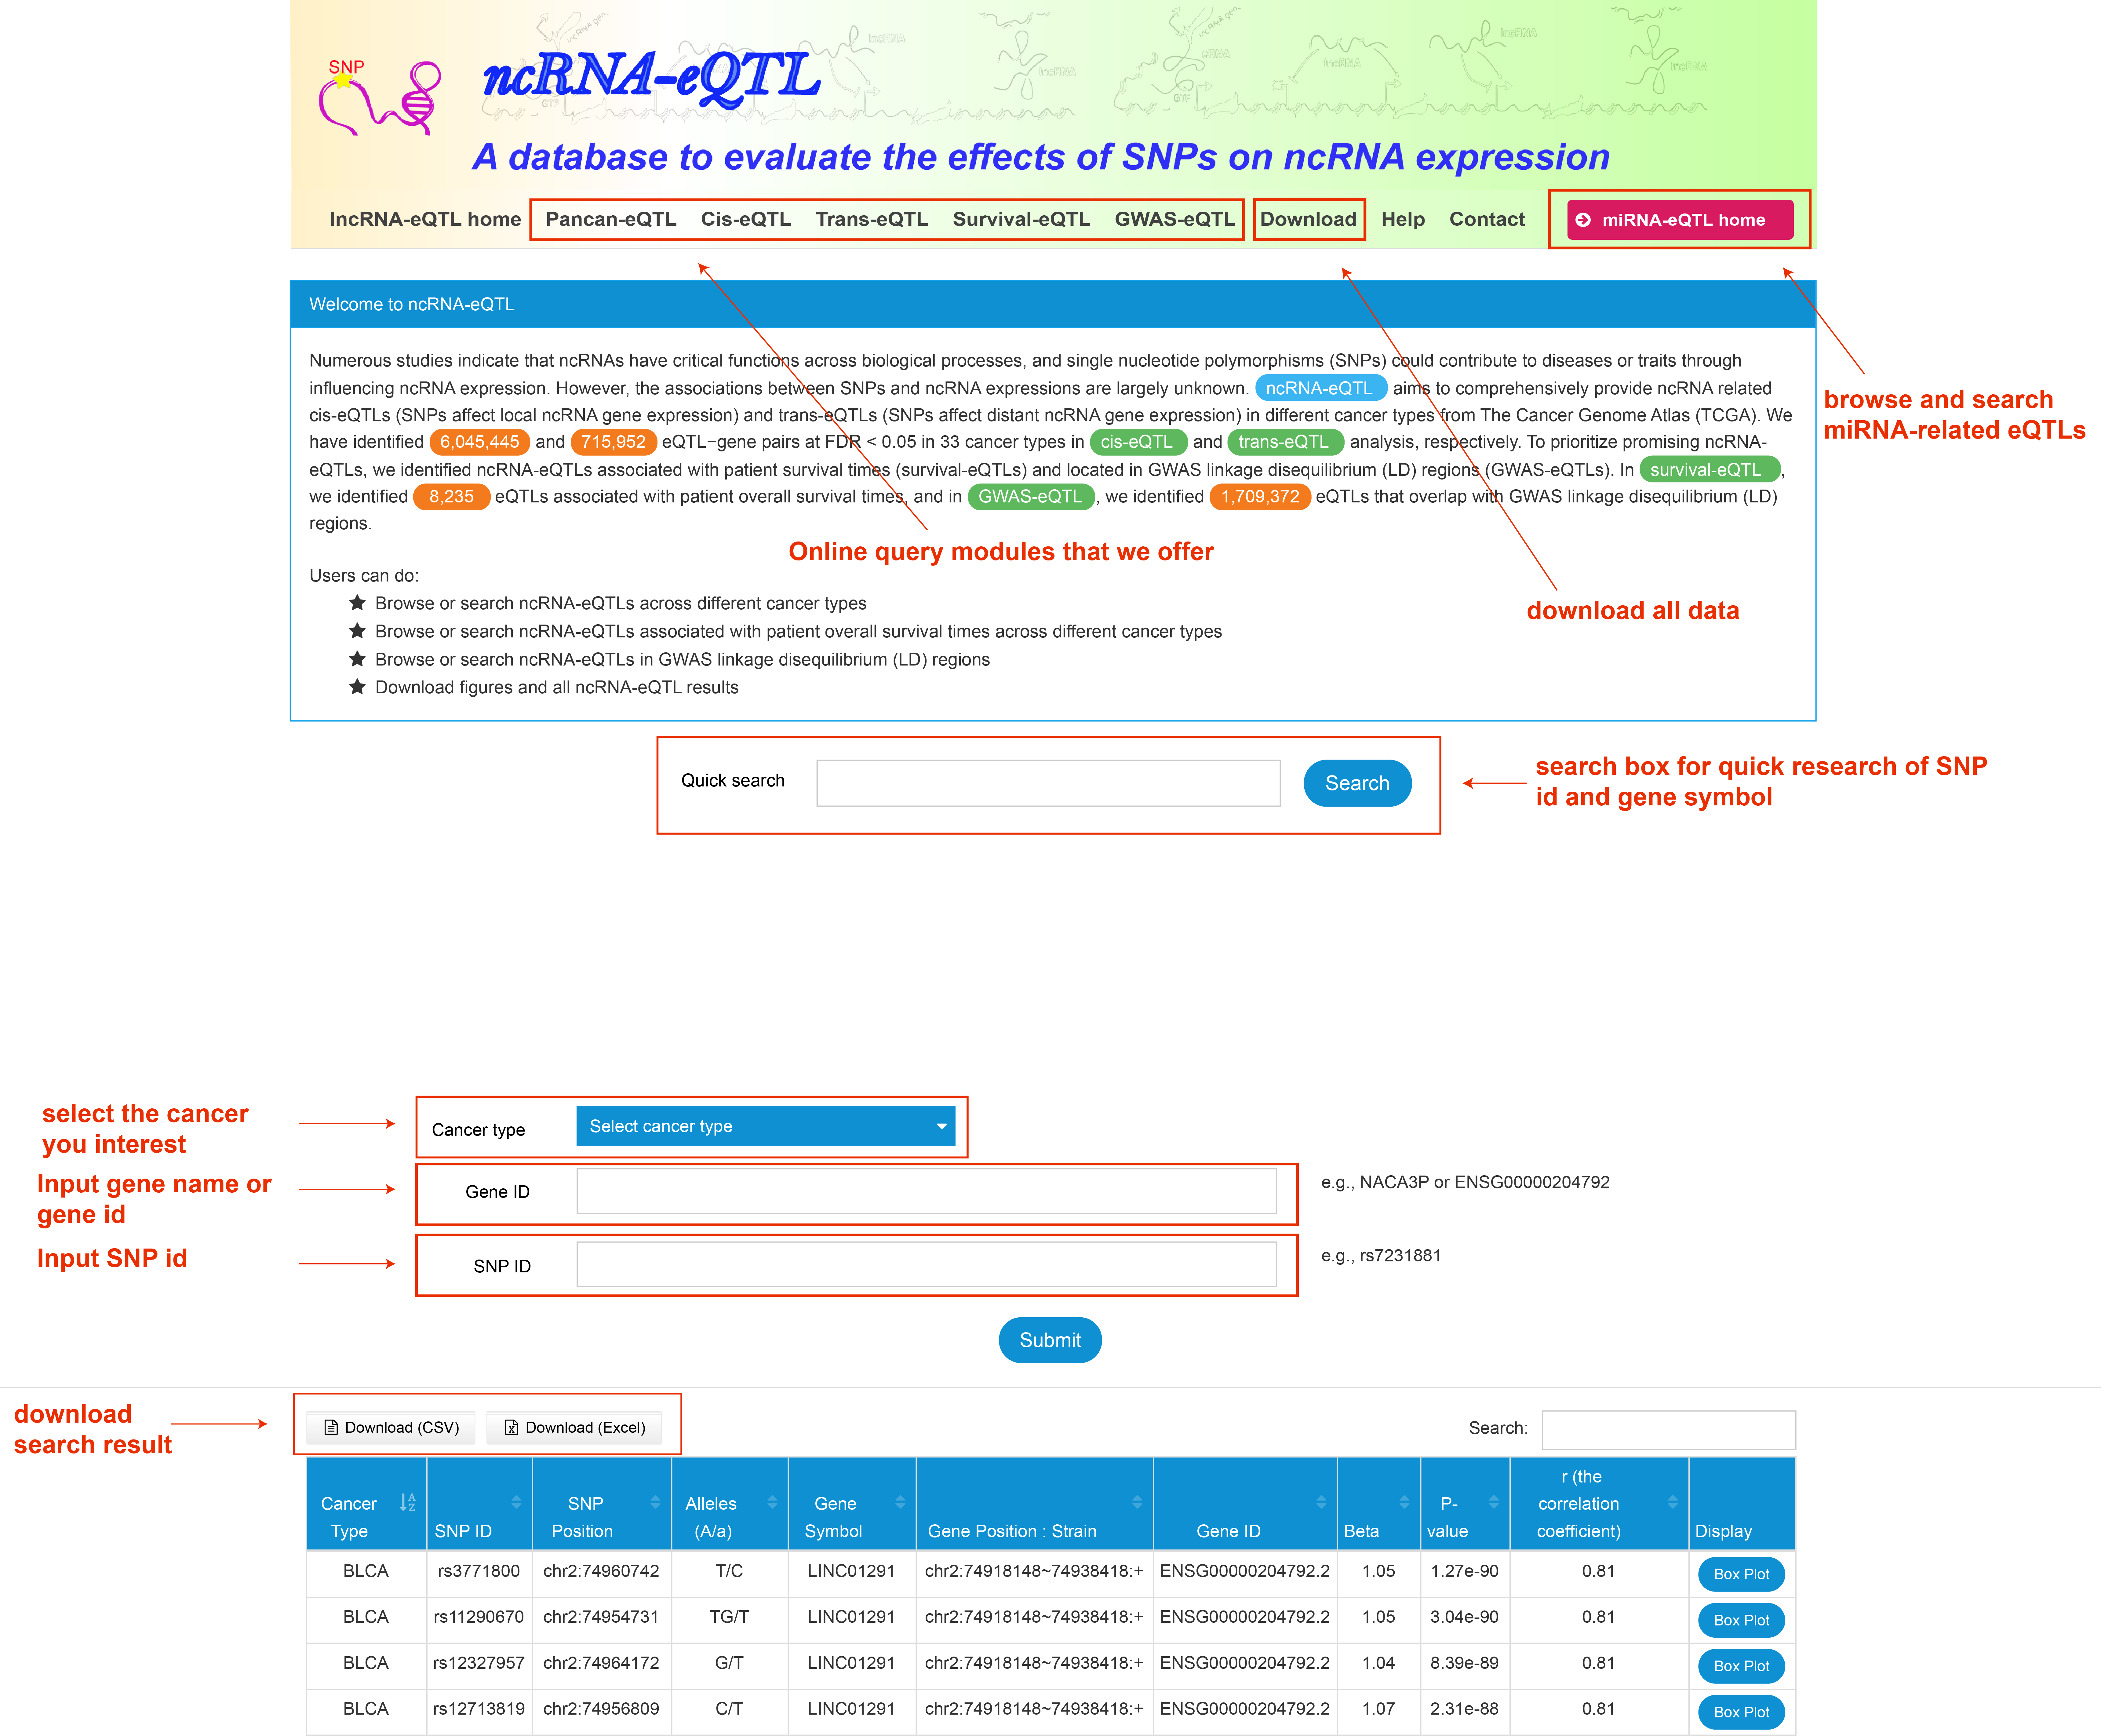
ncRNA-eQTL aims to comprehensively provide ncRNA related cis-eQTLs (SNPs affect local ncRNA gene expression) and trans-eQTLs (SNPs affect distant ncRNA gene expression) in different cancer types from The Cancer Genome Atlas (TCGA). We have identified 6,045,445 and 715,952 eQTL−gene pairs at FDR < 0.05 in 33 cancer types in cis-eQTL and trans-eQTL analysis, respectively. To prioritize promising ncRNA-eQTLs, we identified ncRNA-eQTLs associated with patient survival times (survival-eQTLs) and located in GWAS linkage disequilibrium (LD) regions (GWAS-eQTLs). In survival-eQTL, we identified 8,235 eQTLs associated with patient overall survival times, and in GWAS-eQTL, we identified 1,709,372 eQTLs that overlap with GWAS linkage disequilibrium (LD) regions.
In ncRNA-eQTL database, users can :

SNP ID: Reference id from dbSNP.
SNP Position: The position of SNP including chromosme.
Alleles: SNP alleles.
Gene Position: Strand : Gene genomic position including chromosome, gene region and strand.
r: The correlation coefficient.
Beta: Effect size of SNP on gene expression (calculated by linear regression using a computationally efficient eQTL analysis called Matrix eQTL).
P-value: P-value calculated by Matrix eQTL.
Display: Diagram of boxplot to display the association between SNP genotypes and gene expression.

LD: Linkage disequilibrium.
GWAS Traits: Traits linked with SNP.

Sample Sizes: Number of samples in a cancer type.
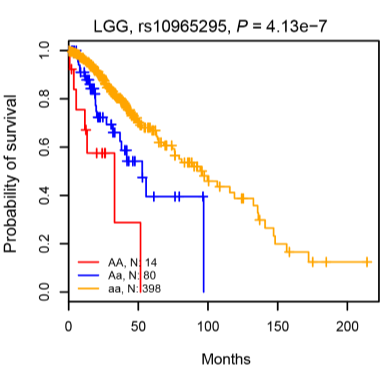
Median Survival Time XX : Median survival times of different genotypes.
Display: Embedd diagram of the Kaplan–Meier plot to display the association between SNP genotypes and overall survival times..
| Cancer type | No. of samples | No. of ncRNAs | No. of genotypes | Cis-pairs | Cis-ncRNAs | Cis-eQTL | Trans-pairs | Trans-ncRNAs | Trans-eQTL |
|---|---|---|---|---|---|---|---|---|---|
| ACC | 77 | 10673 | 3567953 | 6906 | 229 | 6547 | 1030 | 49 | 934 |
| BLCA | 403 | 12090 | 4191159 | 205824 | 4077 | 156228 | 29840 | 935 | 23714 |
| BRCA | 1067 | 13170 | 2745615 | 498969 | 8124 | 308016 | 62764 | 2328 | 46137 |
| CESC | 242 | 12410 | 4276554 | 101968 | 2626 | 82242 | 20779 | 735 | 17555 |
| CHOL | 36 | 12217 | 4012151 | 0 | 0 | 0 | 0 | 0 | 0 |
| COAD | 282 | 11063 | 4505758 | 169256 | 3558 | 129931 | 25618 | 859 | 20423 |
| DLBC | 47 | 11447 | 4819767 | 122 | 8 | 121 | 82 | 4 | 82 |
| ESCA | 148 | 19921 | 4431385 | 44450 | 1238 | 37484 | 6177 | 218 | 4723 |
| GBM | 139 | 15247 | 4525414 | 74593 | 1743 | 61211 | 6109 | 202 | 5518 |
| HNSC | 492 | 11768 | 4249925 | 294234 | 4698 | 217470 | 38283 | 1075 | 31312 |
| KICH | 65 | 11736 | 3755519 | 9289 | 265 | 8075 | 382 | 26 | 320 |
| KIRC | 520 | 14537 | 4578071 | 558380 | 7216 | 380619 | 57962 | 1492 | 47020 |
| KIRP | 287 | 12554 | 4881400 | 228243 | 4350 | 175762 | 28242 | 905 | 22640 |
| LAML | 96 | 19856 | 5078753 | 44537 | 1069 | 34233 | 5570 | 148 | 4802 |
| LGG | 498 | 14213 | 4626469 | 723868 | 7844 | 465249 | 71517 | 1595 | 54899 |
| LIHC | 367 | 9691 | 4157271 | 171255 | 3333 | 128444 | 22425 | 764 | 17725 |
| LUAD | 506 | 13624 | 4384017 | 347537 | 5714 | 249589 | 39040 | 1130 | 31147 |
| LUSC | 495 | 14319 | 3745439 | 321036 | 5556 | 226779 | 44235 | 1236 | 38111 |
| MESO | 81 | 12393 | 4759523 | 15045 | 372 | 14140 | 2154 | 97 | 1779 |
| OV | 251 | 16660 | 2966217 | 102136 | 3423 | 79467 | 11534 | 515 | 9317 |
| PAAD | 177 | 13298 | 4991769 | 139332 | 2623 | 112129 | 16561 | 494 | 13926 |
| PCPG | 174 | 11971 | 4709166 | 119083 | 2571 | 93599 | 16630 | 552 | 14066 |
| PRAD | 478 | 12945 | 4822300 | 604359 | 7181 | 412073 | 69412 | 1686 | 56307 |
| READ | 91 | 11298 | 4540674 | 18312 | 539 | 16750 | 4645 | 153 | 4138 |
| SARC | 257 | 11454 | 4087361 | 105751 | 2607 | 85278 | 17121 | 600 | 14261 |
| SKCM | 103 | 11315 | 4854570 | 14150 | 427 | 13014 | 4856 | 159 | 4501 |
| STAD | 371 | 19117 | 4300207 | 175519 | 3637 | 128258 | 21276 | 635 | 15847 |
| TGCT | 148 | 14304 | 4811363 | 95579 | 1989 | 79971 | 11477 | 325 | 9839 |
| THCA | 495 | 12874 | 4876701 | 702674 | 7426 | 464482 | 57645 | 1353 | 44077 |
| THYM | 119 | 13223 | 4930920 | 92773 | 1907 | 74540 | 9355 | 330 | 7029 |
| UCEC | 173 | 11548 | 4957767 | 44594 | 1327 | 38605 | 9933 | 411 | 8385 |
| UCS | 55 | 13439 | 3871537 | 51 | 5 | 51 | 0 | 0 | 0 |
| UVM | 77 | 9182 | 4692767 | 15620 | 405 | 14530 | 3300 | 128 | 2993 |
| Cancer type | Disease full name |
|---|---|
| ACC | Adrenocortical carcinoma |
| BLCA | Bladder urothelial carcinoma |
| BRCA | Breast invasive carcinoma |
| CESC | Cervical squamous cell carcinoma and endocervical adenocarcinoma |
| CHOL | Cholangiocarcinoma |
| COAD | Colon adenocarcinoma |
| DLBC | Lymphoid neoplasm diffuse large B-cell lymphoma |
| ESCA | Esophageal carcinoma |
| GBM | Glioblastoma multiforme |
| HNSC | Head and neck squamous cell carcinoma |
| KICH | Kidney chromophobe |
| KIRC | Kidney renal clear cell carcinoma |
| KIRP | Kidney renal papillary cell carcinoma |
| LAML | Acute myeloid leukemia |
| LGG | Lower grade glioma |
| LIHC | Liver hepatocellular carcinoma |
| LUAD | Lung adenocarcinoma |
| LUSC | Lung squamous cell carcinoma |
| MESO | Mesothelioma |
| OV | Ovarian serous cystadenocarcinoma |
| PAAD | Pancreatic adenocarcinoma |
| PCPG | Pheochromocytoma and paraganglioma |
| PRAD | Prostate adenocarcinoma |
| READ | Rectum adenocarcinoma |
| SARC | Sarcoma |
| SKCM | Skin cutaneous melanoma |
| STAD | Stomach adenocarcinoma |
| TGCT | Testicular germ cell tumors |
| THCA | Thyroid carcinoma |
| THYM | Thymoma |
| UCEC | Uterine corpus endometrial carcinoma |
| UCS | Uterine carcinosarcoma |
| UVM | Uveal melanoma |