RMSD over time
Ptraj is the component of AMBER which allows you to process your trajectory, or the output coordinate file that describes the movement of your molecule over the course of the simulation. Here we will write two ptraj scripts that take in trajectories, strip out water molecules, and calculate RMSDs. We will graph the RMSDs over time to show deviation from the starting structure over the course of the simulation.
RMSD of system MD (ptraj_rmsd_all.in)
 |
|
 |
|
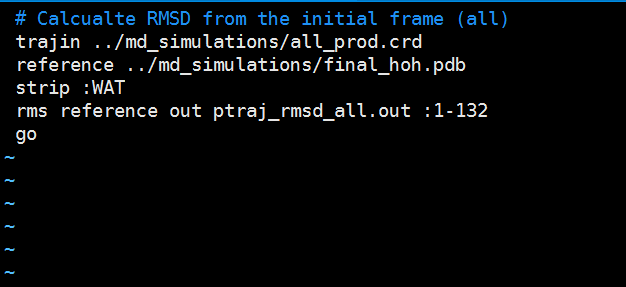 |
Copy the following text and paste it into the ptraj_rmsd_all.in file. Edit the solvated_model.pdb file in red to the correct name for your solvated model pdb got from the tleap. Edit the residue range in red to your correct protein residue number range. Save this file to your hm_analysis directory. # Calcualte RMSD from the initial frame (all)
|
 Navigate to your hm_analysis directory. At the command line, enter the following text, with solvated_model.top in red changed to the correct name for your solvated model top file get from the tleap program. $ cpptraj ../md_simulations/solvated_model.top <ptraj_rmsd_all.in> ptraj_error_all.out
|
|
 |
|
Temperature over time
Here we will extract and graph data from our MD simulation outputs to observe the fluctuation of system temperature over the course of the simulation.
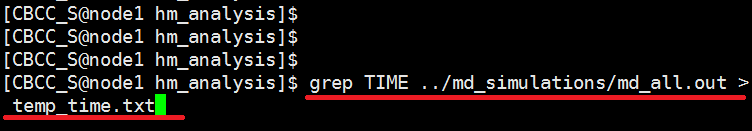 In a terminal window, navigate to your hm_analysis directory and enter the following text. $ grep TIME ../md_simulations/md_all.out > temp_time.txt
|
|
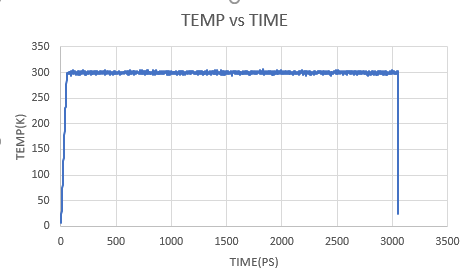 |
Open the temp_time.txt file in Microsoft Excel as delimited by spaces and graph Temperature vs. Time. |
Total energy over time
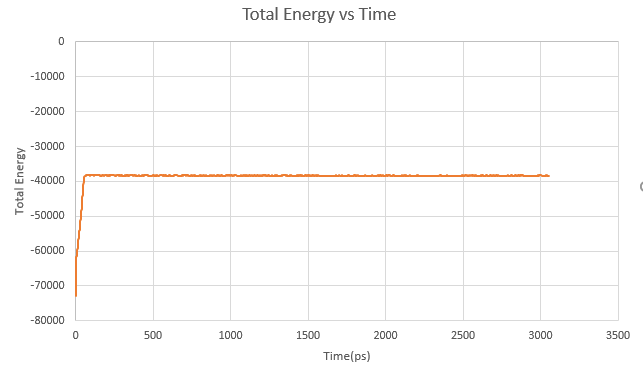
Here we will extract and graph data from our MD simulation outputs to observe the fluctuation of total system energy over the course of the simulation.
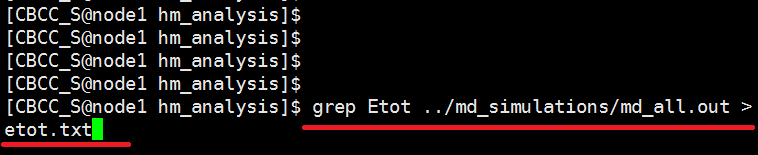 In a terminal window, navigate to your hm_analysis directory and enter the following text. $ grep Etot ../md_simulations/md_all.out > etot.txt
|
|
 |
|
Trajectory movie
The trajectory from your MD simulation is really just a series of sequentially related snapshots and can therefore be thought of as a movie. We will use VMD to render our trajectories in an actual movie format.
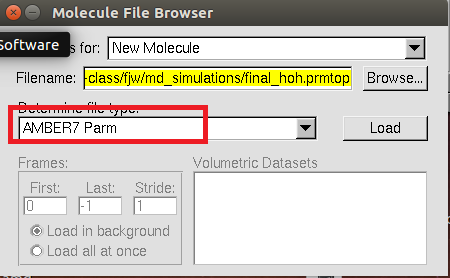
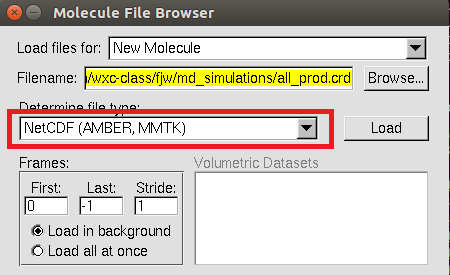
At first , you need to copy your solvated *.prmtop and all_prod.crd file to you local computer with scp command.
In Mac, search VMD in Lauchpad and double click VMD to open it.
 |
|
 |
|
 |
|
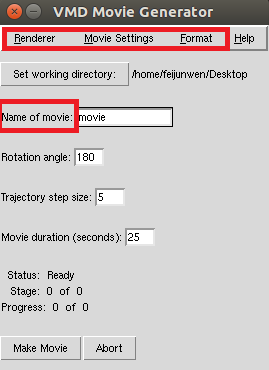 |
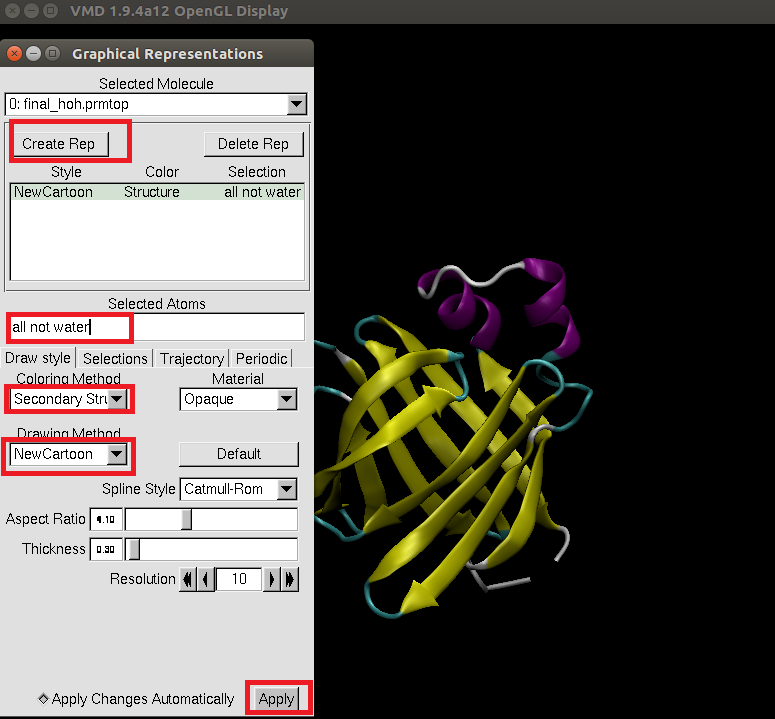
Once the trajectory has finished loading and you have a representation/orientation of the model that you like, go to Extensions->Visualization->Movie Maker. In the VMD Movie Generator, set the parameters to the following:
Click Make Movie to begin making a movie of your trajectory. The process should take about 5 minutes. You are expected to use this movie in your Project 1 presentation. |
The refined homology model
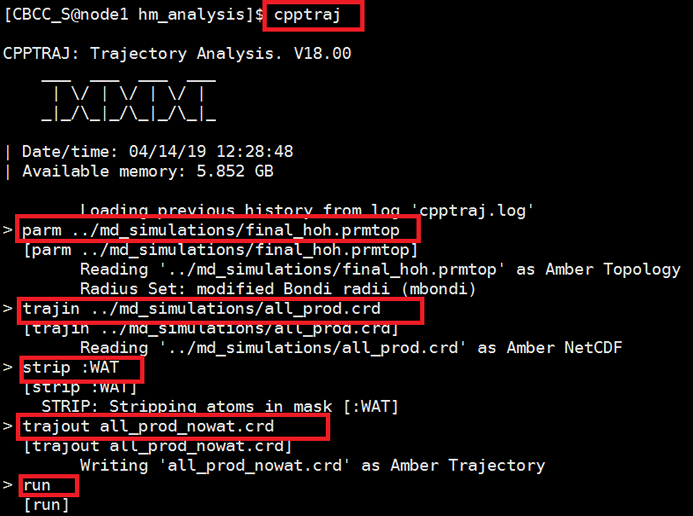
Unlike your initial homology model, which is represented by a convenient single structure, your refined homology model is described by a trajectory, or series of sequentially related structures. In order to obtain a single structure and data set that can be compared directly with the initial model, we will calculate averages from the refined model trajectory.
Calculate the average structure
|
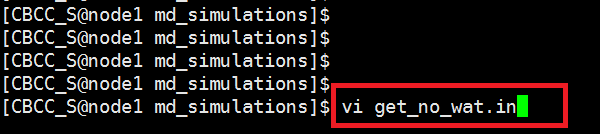
 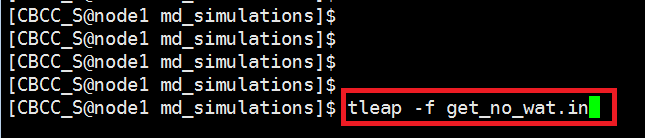 We focus on the protein ,not water ,so here we need to get a no solvated model with tleap program in md_simulations folder. $ vi get_no_wat.in Copy the following text and paste it into the get_no_wat.in file. Save this file to your hm_analysis directory. source oldff/leaprc.ff99SB And run tleap program with get_no_wat.in as input script. $ tleap -f get_no_wat.in
|
 |
|
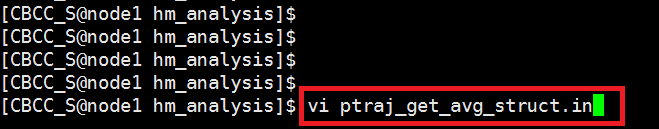 First, we will use cpptraj to calculate the average structure based on all the different structures observed over the course of the simulation. Note that the average structure is not real! Travel to hm_analysis folder ,In a terminal window, use the vi editor to open a new file called ptraj_get_avg_struct.in. $ vi ptraj_get_avg_struct.in
|
|
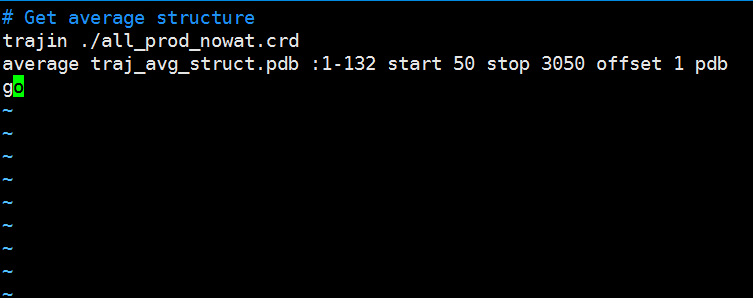 |
Paste the following text into the ptraj_get_avg_struct.in file and edit the residue range in red to the correct residue range for your protein. Save the file to your hm_analysis directory. # Get average structure
trajin ./all_prod_nowat.crd
|
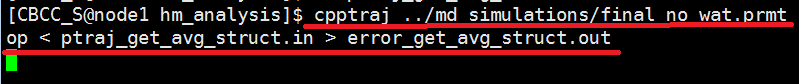 Run the ptraj script by entering the following text at the command line. Edit the no_solvated_model.top file in red to the correct filename of your no_solvated_model.top. $ cpptraj ../md_simulations/no_solvated_model.top < ptraj_get_avg_struct.in > error_get_avg_struct.out
|
Find the structure most like the average
Next, we will calculate RMSD from the average structure over the course of the simulation. From this, we can see which structure from the MD is the best approximation of the average structure. This way we get an "average" structure that is real.
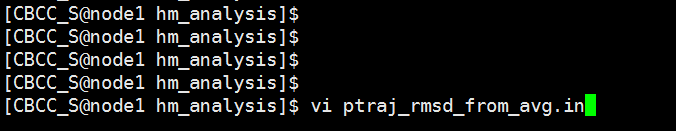 In a terminal window, use the vi editor to open a new file called ptraj_rmsd_from_avg.in. $ vi ptraj_rmsd_from_avg.in
|
|
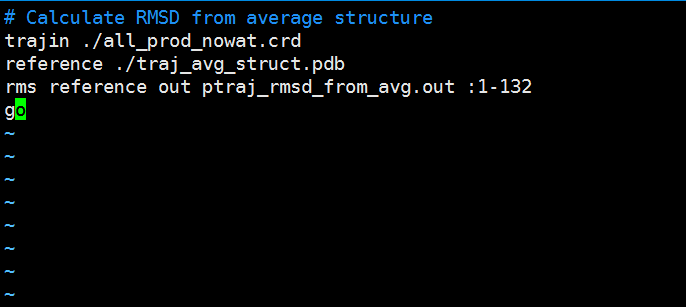 |
Paste the following text into the ptraj_rmsd_from_avg.in file and edit the residue range in red to the correct residue range for your protein. Save the file to your hm_analysis directory. # Calculate RMSD from average structure
|
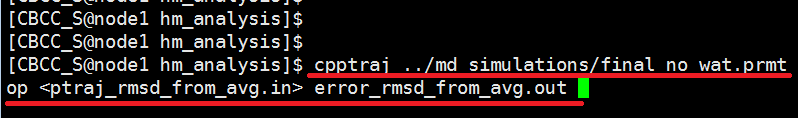 Run the ptraj script by entering the following text at the command line. Edit the final_no_wat.prmtop file to the correct filename of your no water *.top file model. $ cpptraj ../md_simulations/final_no_wat.prmtop <ptraj_rmsd_from_avg.in> error_rmsd_from_avg.out
|
|
 |
|
Obtain snapshot of the structure most like the average
Finally, we will extract the structure we will use to represent our refined homology model from the 3000 others in the trajectory.
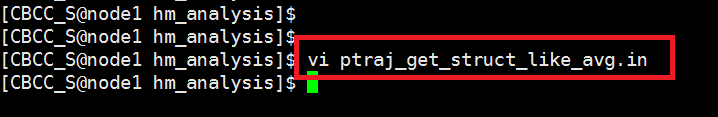 |
|
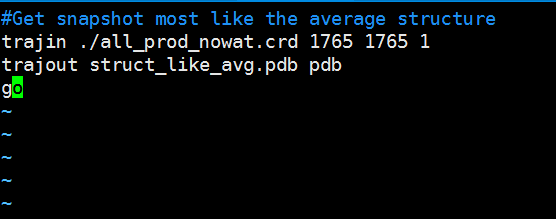 |
Paste the following text into the ptraj_get_struct_like_avg.in file and edit the numbers in red to the correct time step of the structure with the lowest RMSD from the average structure. Save the file to your hm_analysis directory. #Get snapshot most like the average structure
|
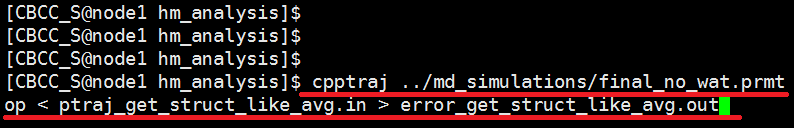 Run the ptraj script by entering the following text at the command line. Edit the final_no_wat.prmtop file to the correct filename of your no water *.top file model. $ cpptraj ../md_simulations/final_no_wat.prmtop < ptraj_get_struct_like_avg.in > error_get_struct_like_avg.out |
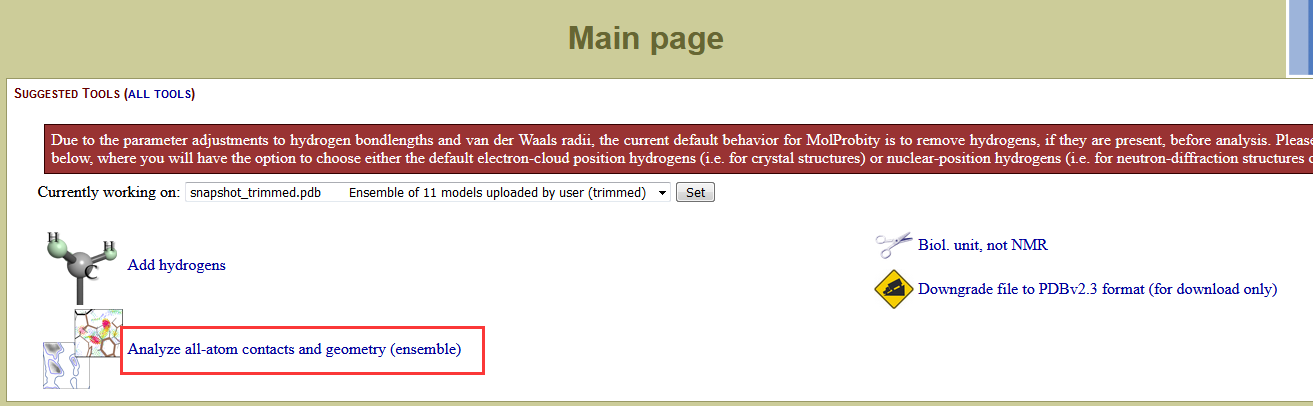
Evaluate the rationality of the model
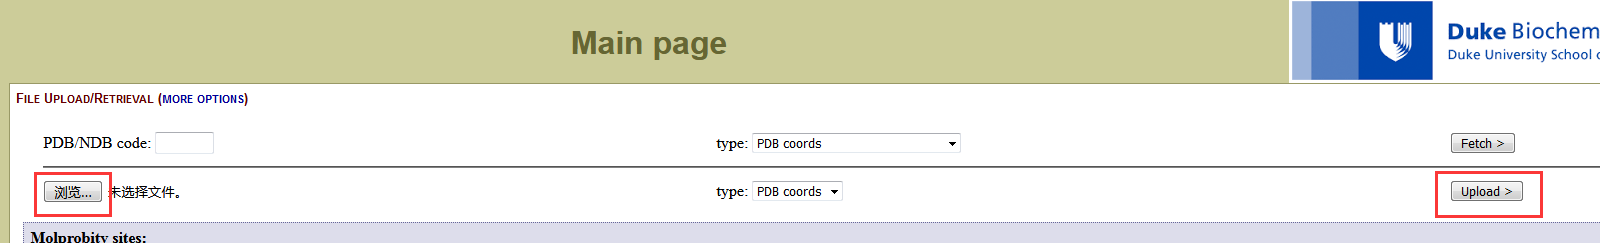 We will choose the structure most like the average of the simulation to submit to the Mol Probity website to obtain Ramachandran plots of our models. Copy this file to your local computer. Go to the website and upload the file (file name) we just copied from server. Once the file has been uploaded, you will see “the job is running”. Click Continue. |
|
 |
|
 |
|
 |
On the Analysis output page, click View next to Ramachandran plot PDF. Save this PDF to your hm_analysis directory. |