Automated Docking
Introduction
Molecular docking is the placement of molecules in a known three-dimensional structural database one by one at the active site of the target molecule. By optimizing the position and conformation of the acceptor compound, the dihedral angle of the inner rotatable bond, and the side chain and backbone of the amino acid residue of the acceptor, the optimal conformation of the acceptor small molecule compound and the target macromolecule is sought and predicted. A combination of mode, affinity, and a method for simulating intermolecular interactions by selecting a ligand with optimal affinity for the receptor that is close to the natural conformation by a scoring function.
At here, we select #2HMB as sample, because in previous class, we did homology-modeling about the PDB and get a PDB file without hydrogen atoms.
Workstation setup
In order to avoid file mix-ups, create a new parent directory for autodock and move all associated files and directories there.
$ mkdir autodock
$ cd autodock
File acquisition and preparation
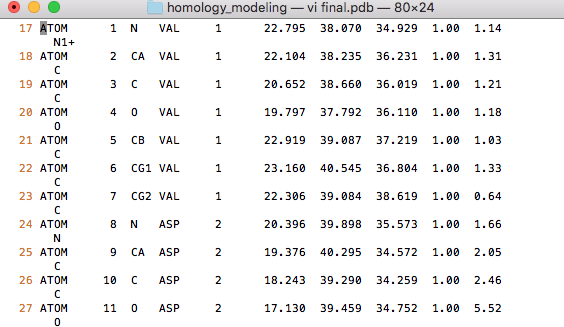
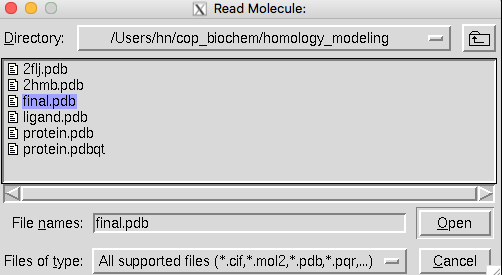
The docking program we will use needs minimized structures in order to correctly assign charges to protein residues. In order to save time, a minimized and correctly formatted version of the 2HMB crystal structure is provided here, along with the palmitate ligand structure.
 |
 |
|---|---|
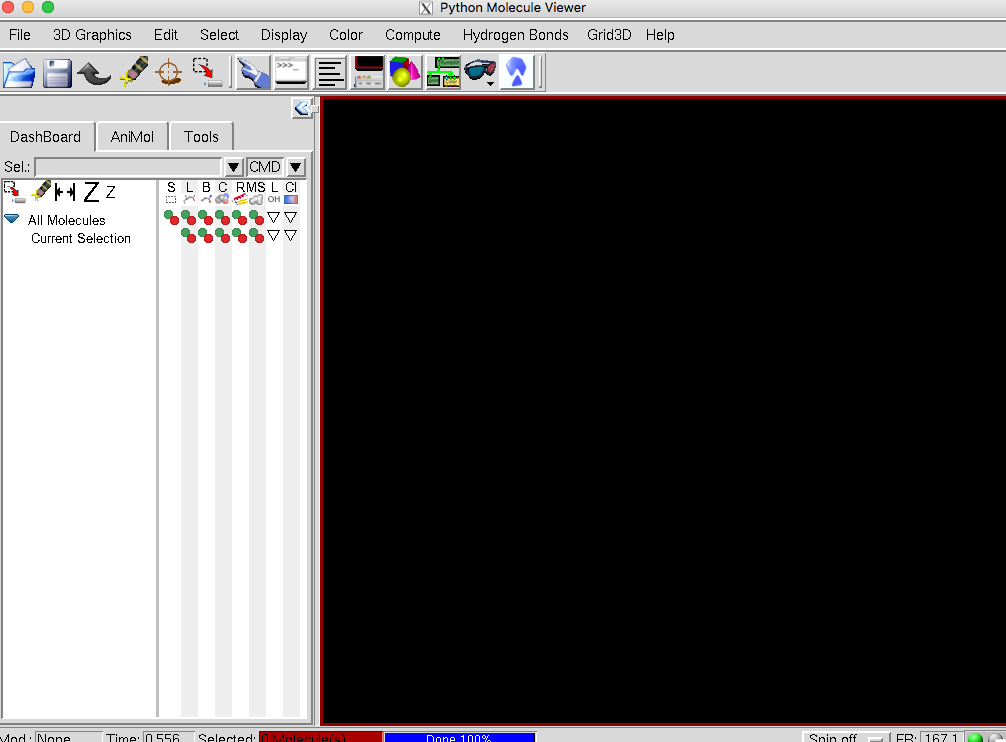
 Now, open a new terminal, type as follow: $ source ~/.bashrc $ pmv |
|
 |
 |
 |
 |
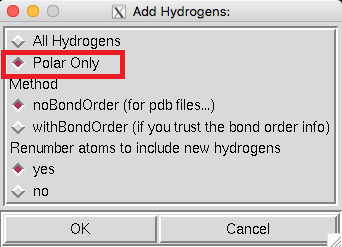 |
 Since we removed the hydrogen atoms of the protein during the homology modeling in the previous lesson, we need hydrogenation here. Click Edit->Hydrogens->Add, and select Polar Only to hydrogenation. |
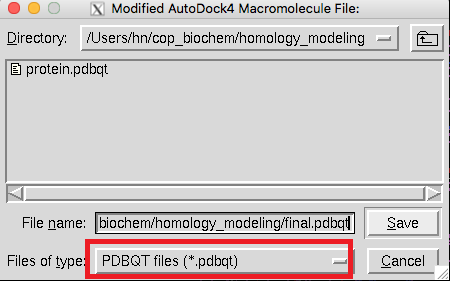 |
 Now we save this molecule as *.pdbqt file ,because it is useful for our experiments later. Autodock Tools-> Grid->Macromolecule->choose: your molecule ->Select Molecule and input your file name to save it. Do as follow to save ligand as *.pdbqt file. Ligand->input->open your ligand pdb file ->OK. Ligand->Output->Save as *.pdbqt file. |
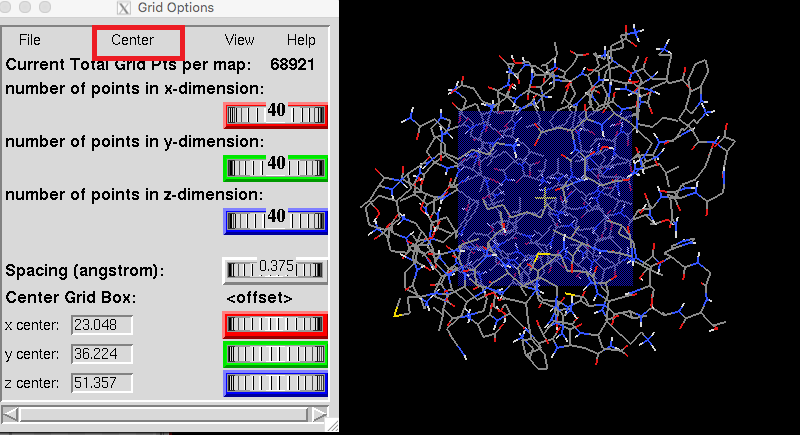 |
 For subsequent calculations, we need to find the center of the protein for molecular docking. Grid->Set Map Types->Choose ligand->select your ligand ->Select Ligand. Grid->Grid Box->Center. Then we will get the coordinates of center, By adjusting the number of points in x/y/z dimension and Spacing. You will notice that the blue area on the molecular map will become larger or smaller. Remember this center's coordinates and number of points in x/y/z dimension. |
Build docking parameter file and perform docking
 |
|
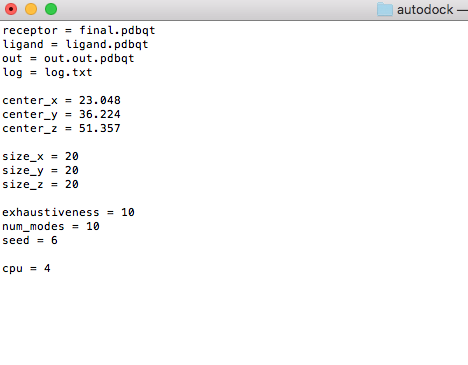 |
 Copy following contents to your conf.txt file, and with :wq to write and quit vi editor. You can change the values of size_x/y/z. receptor = final.pdbqt ligand = ligand.pdbqt out = out.out.pdbqt log = log.txt
center_x = 23.048 center_y = 36.224 center_z = 51.357
size_x = 20 size_y = 20 size_z = 20
exhaustiveness = 10 num_modes = 10 seed = 6 cpu = 4 |
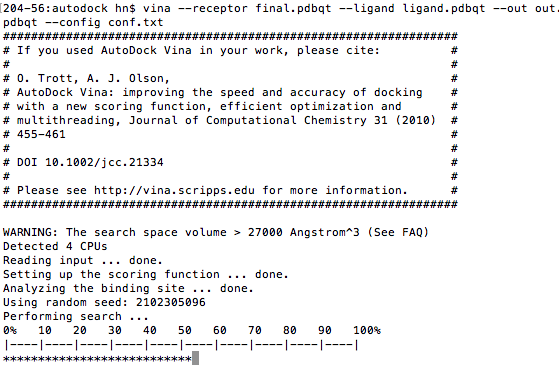 |
 Now, we can start docking with AutoDock Vina. The *.pdbqt file depends on your fine's name. $source ~/.bashrc $ vina --config conf.txt |
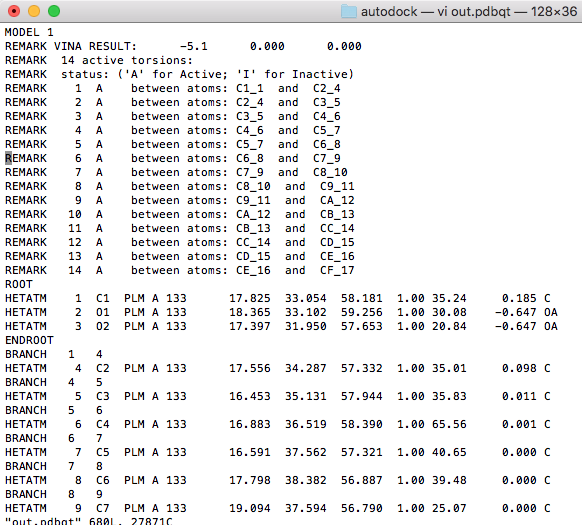 |
 Waiting for about a minute, we found the docking result in the out.pdbqt file. $ vi out.pdbqt |
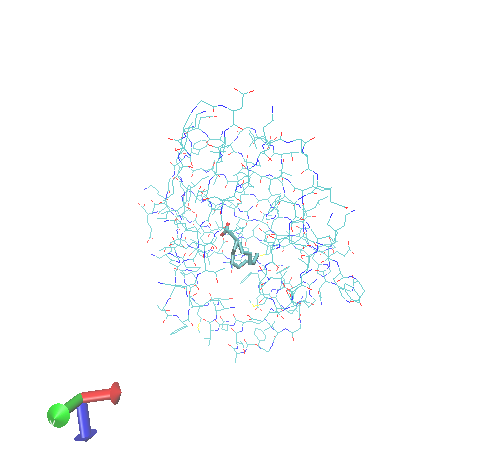
Visual docking results
 |
|
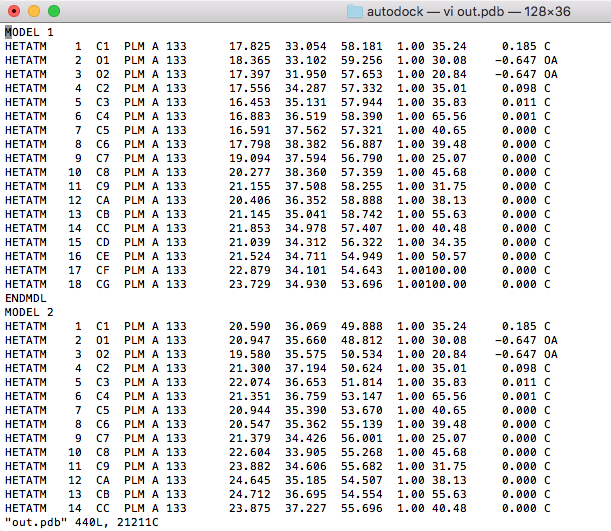 |
 And open the *.pdb file with vi editor, delete unnecessary lines for each model, leaving only the coordinate information. |
 |
 |
 |
 |
 |